
In short
Root cause analysis (RCA) is worth running on failures that are expensive, repeated or unsafe. Everything else is repaired and recorded.
Use 5 whys for a single causal chain, a fault tree where several causes must combine, and an evidence-led investigation for major events.
A cause is a root cause only if removing it would have prevented the failure. The fix has to reach the maintenance strategy or the design, and the failure data has to show it worked.
Pardus carries repeat-failure findings into the maintenance strategy so the fix is not lost.Reliability engineering
Root cause analysis (RCA) traces a failure back to the cause that, if it had been removed, would have prevented it. The part that is replaced on the day is almost never that cause. A seal that failed is the failure. The reason it failed, and the reason the plant let that reason exist, is what the analysis is for.
A plant cannot analyse every failure, so the first decision is which ones to take on. The second is the method. The third, which most analyses skip, is how the fix will be carried out and how the plant will know it worked.
Which failures to analyse
Set a trigger and apply it every time. Common triggers are any safety or environmental event, any failure above a set downtime or cost, and any failure that has happened more than a set number of times in a year on the same asset or component. The first two catch the large events. The third catches the repeats, which a work order system hides because each one looks small.
A Pareto chart of downtime or maintenance cost by failure mode finds the repeats. Count the hours by the failure mode on the work order, not by the equipment tag, and the chart points at the problems worth the effort.
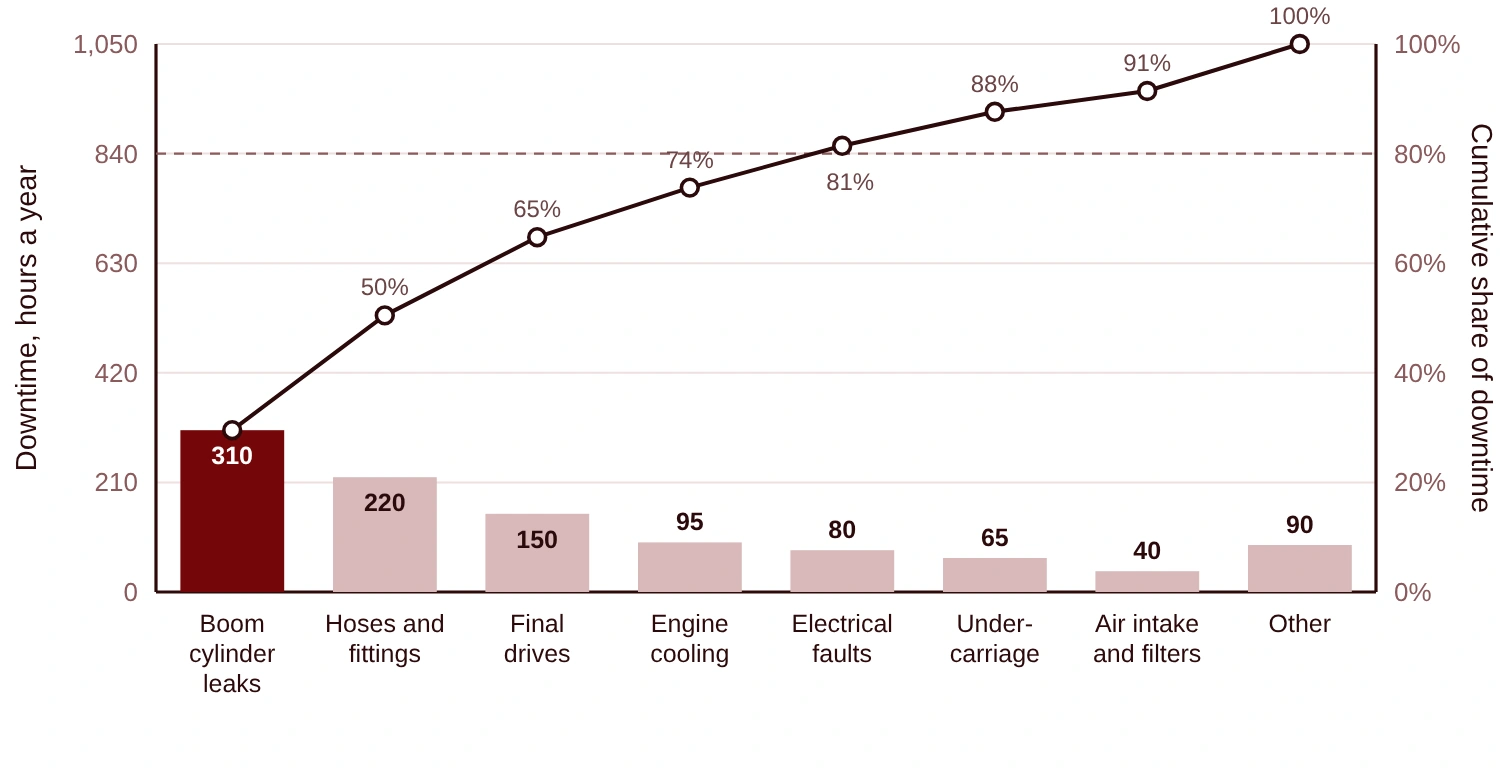
In this example fleet (illustrative hours, 1,050 a year in total) the boom cylinder leaks are the largest single mode at 310 hours, 30% of the downtime. The first two modes are half of it. The cylinder leaks would be the first RCA. The Pareto only works if the failure codes on the work orders are specific. If most work orders are closed against “hydraulic fault”, the chart cannot separate a leaking seal from a burst hose, and the first job is to fix the code list.
Choosing the method
| Method | Suited to | Weakness |
|---|---|---|
| 5 whys | A single causal chain with a clear failure | Fails when several causes combine, and the answer depends on who asks |
| Fishbone (Ishikawa) | Listing candidate causes with a group, by category | It lists possibilities. It does not test any of them |
| Fault tree | Failures where two or more conditions must coincide | Takes more effort, and the probabilities need data |
| Evidence-led investigation | Major or unexplained events | Slow and needs preserved evidence |
5 whys. Ask why repeatedly until the answer is something management can change. It is quick, and a single chain is often all a failure needs. It fails in two ways. A failure caused by two conditions together does not have one chain, and the method will follow whichever branch the group thought of first. And the questions are only as good as the evidence behind each answer. A fifth “why” resting on a guess carries no more weight than the guess.
Fishbone. The diagram sorts candidate causes into categories, commonly people, equipment, method, material, measurement and environment. It is good for getting a group to think past the first idea. Treat its output as a list of hypotheses to be tested.
Fault tree. The fault tree starts from the failure at the top and breaks it into the combinations of causes that produce it, joined by AND and OR gates. An AND gate means every input must be present for the output to occur. An OR gate means any one is enough. Fault tree analysis is covered by IEC 61025. A set of causes that together produce the top event is a cut set. The cut sets with a single cause are the ones to look at first, because one event is enough.
Evidence-led investigation. For major events, preserve the failed parts, collect the operating and maintenance records, take statements from the people involved, and test each hypothesis against the evidence before accepting it. Metallurgical or laboratory examination of the failed part belongs here. The investigation builds a timeline first and the causes second.
A 5 whys example, and where it should stop
The same failure shows how far the questions have to go. The machine stopped because a boom cylinder leaked, and the chain runs like this.
- Why did the machine stop? The rod seal leaked hydraulic oil.
- Why did the seal leak? The surface of the rod was scored.
- Why was the rod scored? Abrasive dust got past the wiper seal and was dragged across the rod.
- Why did the dust get past? The wiper seal was worn and had not been replaced.
- Why was it not replaced? The wiper seal is on no inspection route, and it is replaced only when the cylinder is opened for another reason.
The fifth answer is something management can change, so the chain can stop. It also shows the three levels a cause can sit at. The physical cause is the scored rod. The human cause is a worn wiper that nobody replaced. The latent cause is a maintenance strategy with no task for the wiper, and that is the one that will produce the next failure on the next cylinder. An analysis that stops at the second answer replaces the seal and fixes none of it.
A worked fault tree: the boom cylinder
The top event is a boom cylinder leak that stops the machine. Two paths lead to it. The rod seal can leak, or a hose or fitting can fail. The rod seal leaks only when two conditions are both present: abrasive dust reaches the rod, and the wiper seal that should keep it off is worn and has not been detected. Probabilities are per year for one cylinder, and are illustrative.
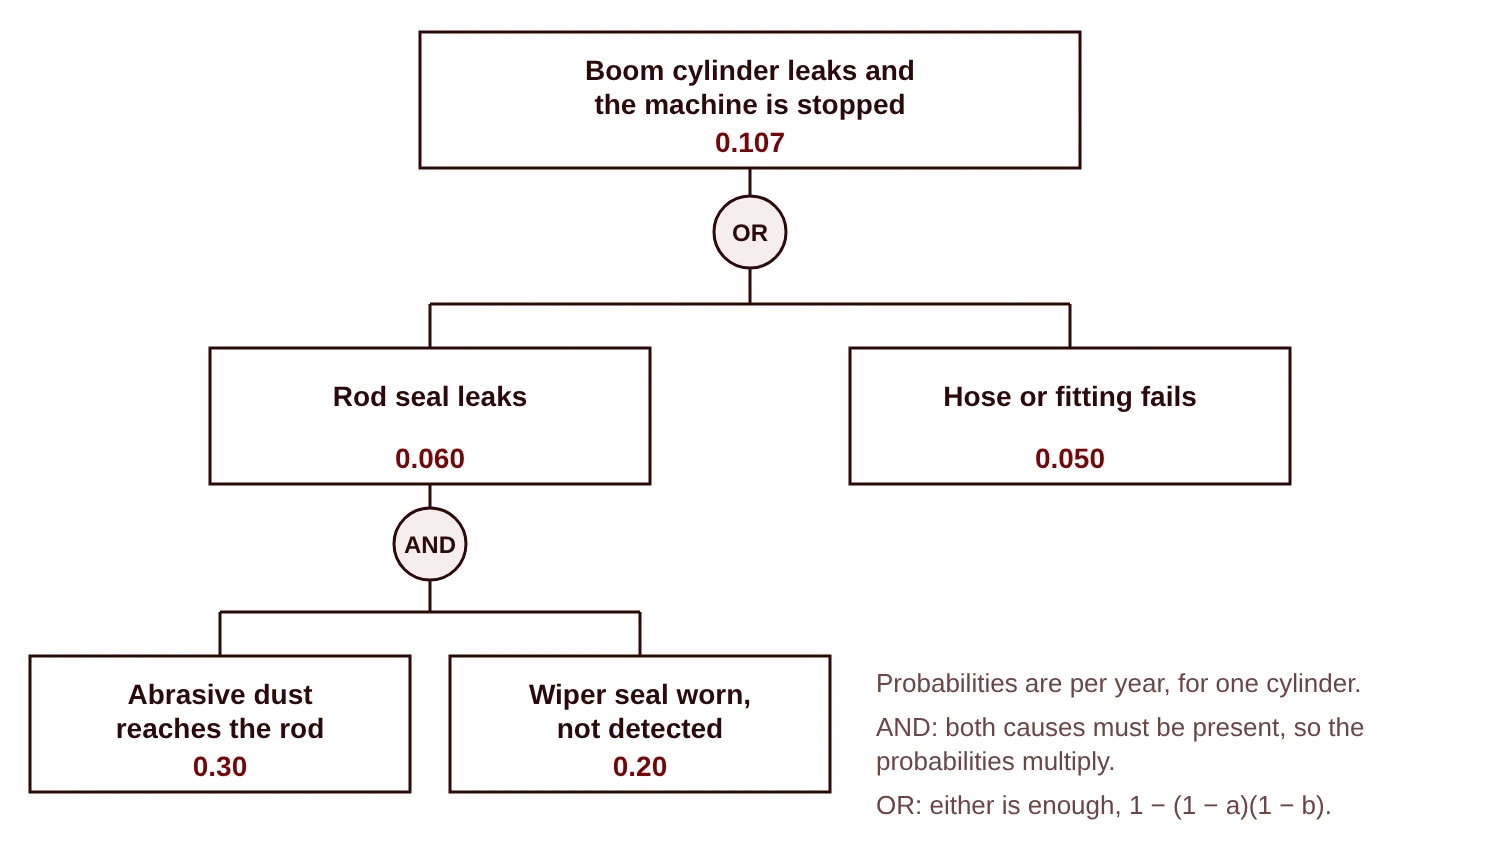
The arithmetic follows the gates, and assumes the causes are independent. Dust does wear the wiper, so the two are not strictly independent, and the product slightly understates the chance of both. The example keeps the calculation simple.
- AND gate. Both causes must be present, so the probabilities multiply: 0.30 × 0.20 = 0.060.
- OR gate. Either path is enough, so the probability is one minus the chance that neither happens: 1 − (1 − 0.060)(1 − 0.050) = 1 − 0.94 × 0.95 = 0.107.
So a cylinder has about a one in nine chance of a stopping leak each year, and the rod seal path accounts for a little over half of it. The tree also shows what each fix is worth.
| Action | Rod seal path | Hose path | Top event |
|---|---|---|---|
| None | 0.060 | 0.050 | 0.107 |
| Wiper seal checked on the route, so wear is found before the rod is scored: 0.20 down to 0.05 | 0.015 | 0.050 | 0.064 |
| Rod protected from dust with a boot or bellows: 0.30 down to 0.10 | 0.020 | 0.050 | 0.069 |
| Both | 0.005 | 0.050 | 0.055 |
Either action alone cuts the top event by between a third and 40%. Doing both takes the rod seal path to almost nothing, and the top event falls only to 0.055, because the hose path of 0.050 is now nearly all of it. That is a useful result. The next analysis is the hose and fitting failures, and the numbers say so.
Tests for a root cause
Before accepting a cause, check three things.
- Would removing it have prevented this failure? If the failure would have happened anyway, it is a contributing factor and not the root cause.
- Is there evidence for it? A plausible story is not evidence. The evidence is the failed part, the data, the records or the statements.
- Can the organisation change it? “Operator error” and “bearing failed” both stop short. Ask why the procedure allowed the error, or why the bearing was not protected.
The evidence is lost quickly. Keep the failed part, photograph it in place before it is moved, and take the control system and maintenance records for the period before the failure, before anyone cleans up. A fifth “why” with no part to look at is the usual reason an analysis stops at a person.
What the report contains
A one-page report is enough for most failures. It states the event and what it cost, a timeline, the evidence, the cause chain or the tree, the actions with an owner and a date for each, and a date when the result will be checked. If it has no check date and no owners, nobody will do the work.
Making the fix last
Most findings are lost because the action is a one-off. A repair order closes, the report is filed, and the same failure returns a year later when the staff have changed. Put each action where it will be done again.
- Elimination or design change. Remove the cause. Fit a rod boot, or change the seal specification, through the plant’s change process.
- Maintenance strategy. A changed task or interval in the maintenance strategy and the CMMS task list, so it is planned and scheduled. In the example, the wiper seal check becomes a line on the route.
- Procedure or standard. A changed standard or procedure, with training. This is the weakest of the three, because it depends on people remembering.
Where the failure data shows wear-out behaviour, a Weibull analysis shows whether the replacement interval needs to move.
Checking that it worked
The check is the failure data, and it should be set up before the fix goes in. In the example, the cylinders had 14 leaks in 12 months, a rate of 1.17 a month. The fix went in at month 12.
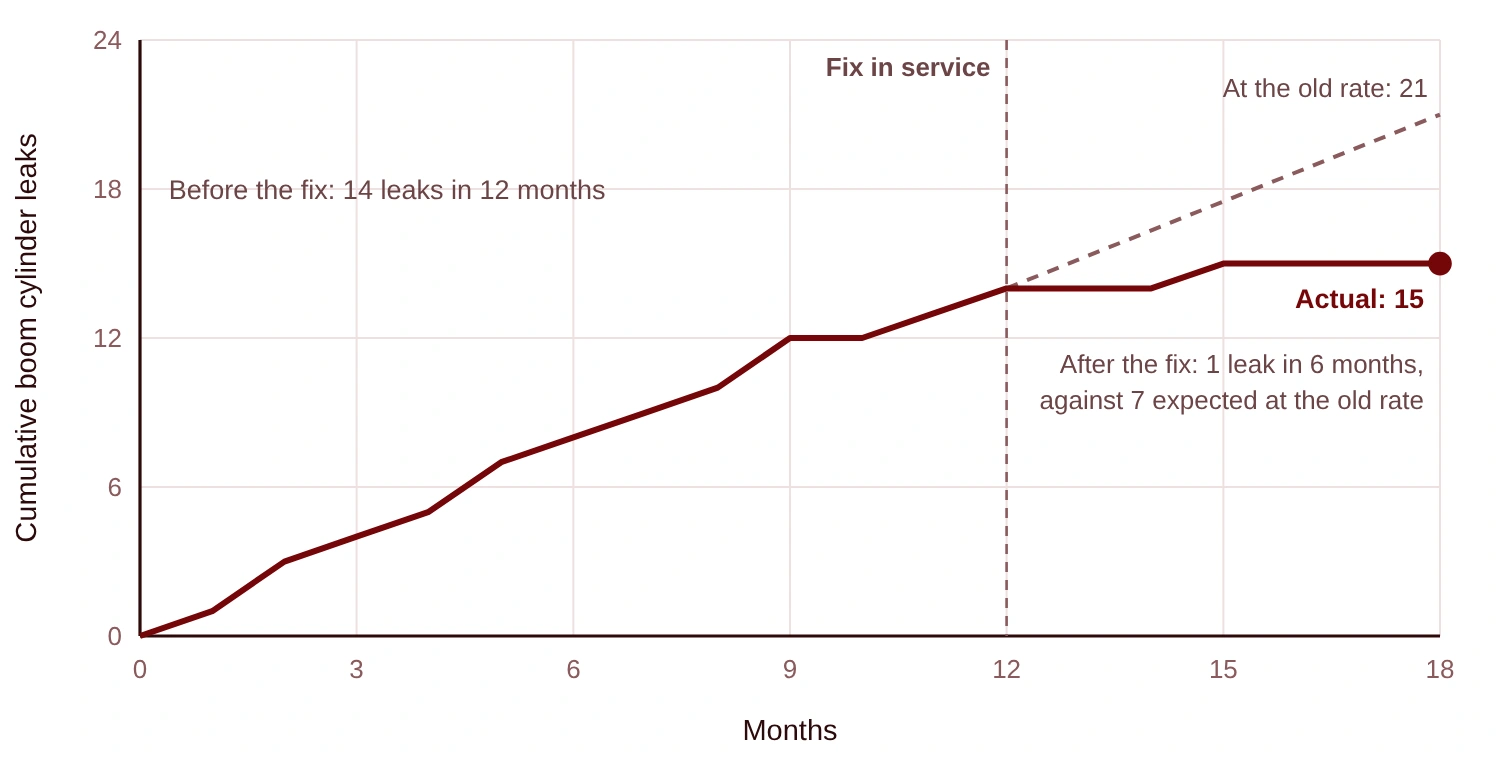
Over the next six months there was one leak. At the old rate there would have been 7. If nothing had changed, the number of leaks in six months would follow a Poisson distribution with a mean of 7, and the probability of one or none is e⁻⁷ × (1 + 7) = 0.0073, under 1%. That is good evidence that the fix worked, and not a quiet spell.
Rare failures cannot be checked this way. A failure that happens once a year takes years to confirm. For those, check a leading indicator that the fix should change, such as the wiper seal condition found at the route inspections, or the particle count in the hydraulic oil.
Where analyses go wrong
Most analyses fail before the method matters. They stop at a person, with “the operator did not follow the procedure”, when the question is why the system allowed it. They start without the failed part or the records, so the argument is over recollections. They use a team of twelve when four to six people who know the equipment are enough, and they finish with actions that have no owner and no date. Some triggers are set so low that every failure qualifies and the team completes none of them. Few analyses are checked afterwards against the failure data, which is the only way to learn that a fix did not work.
Miguel Pengel, RPEQ (Mechanical) 28380, is the principal engineer at Pardus Consulting and the author of Reliability Engineering for Heavy Industry. About Pardus.