
In short
FMEA lists failure modes and their effects. FMECA adds criticality, so the modes can be ranked and the effort aimed at the ones that matter.
A risk matrix tied to the site's own risk standard ranks failure modes better than a risk priority number. In the worked pump example the RPN puts a casing wear-through last and the matrix puts it first.
An analysis is finished only when each failure mode worth managing has a task, an interval, a trade, a plant state and a spares position, and those are loaded to the CMMS.
Pardus runs FMECA workshops on RCM principles and loads the resulting tasks to your CMMS.Maintenance strategy development
Failure mode and effects analysis (FMEA) is a structured list of the ways an item can fail and what happens when it does. Failure mode, effects and criticality analysis (FMECA) is the same list with a criticality ranking added, so the failure modes can be sorted by how much they matter. In maintenance work the two names are often used for the same exercise. The difference that counts is the ranking, and how the ranking is done decides whether the analysis produces a maintenance strategy or a large spreadsheet that nobody opens again.
This article covers where the standards draw the line between the two, the columns a plant FMECA needs, a worked pump example scored two ways, how to pick a task for each failure mode, and how to run the workshop.
FMEA and FMECA in the standards
The method comes from US military reliability work. The procedure was published as MIL-P-1629 in 1949 and reissued as MIL-STD-1629A in 1980. The current international standard is IEC 60812, which covers both and treats FMECA as a variant of FMEA in which the failure modes are ranked by criticality.
Criticality can be done two ways.
- Quantitative. MIL-STD-1629A gives each failure mode a criticality number, Cm = β × α × λp × t. Here λp is the failure rate of the item, α is the fraction of those failures that take this mode, β is the probability that the mode causes the loss of function, and t is the operating time. The item criticality is the sum over its modes. It needs failure rates split by mode, which a plant seldom has at the maintainable-item level, so it is used mostly in design and safety work.
- Qualitative. Each mode is scored on a risk matrix of likelihood against consequence, or with a risk priority number (RPN). This is what operating plants use, because the inputs come from the people who run and repair the equipment.
Reliability-centred maintenance (RCM, SAE JA1011) adds two things to the FMEA: a consequence assessment for every failure mode, and a decision logic that selects a task or a no-task decision. Most plant FMECA work is RCM in that sense, and the rest of this article follows it.
What goes in each row
A plant FMECA is written at the level where maintenance is done, the maintainable item: a gearbox, a pump, a conveyor pulley, a hydraulic cylinder. Each row answers six questions.
- Function. What the item must do, with a performance standard, for example “transfer slurry at 400 m³/h at 55 m head”.
- Functional failure. How it can fail to do that: delivers none, delivers less than the standard, delivers when it should not.
- Failure mode. What physically causes the functional failure, such as impeller wear or a seized bearing.
- Cause. Why the mode happens: abrasive slurry, lubricant contamination, misalignment.
- Effect. What is seen when it happens and what else is damaged.
- Consequence. Safety, environment, production or repair cost. This decides how much the failure is worth managing.
Write the failure mode at the level of the cause you would aim a task at. “Bearing fails” gives nothing to act on. “Bearing seizes from lubricant contamination” does. Write each mode once for the item, and add a row for the same mode only when the cause changes the task.
A worked example: a slurry transfer pump
The function is to transfer slurry at 400 m³/h at 55 m head. The scores below are illustrative, set for the example, and not from any site. Severity, occurrence and detection use the usual 1 to 10 scales. Severity 10 is a safety event with no warning, occurrence 10 is a failure almost every month, and detection 10 means nothing in place would reveal the failure developing. For the matrix, likelihood and consequence each run from 1 to 5.
| # | Failure mode | Effect | S | O | D | RPN | Matrix (likelihood × consequence) |
|---|---|---|---|---|---|---|---|
| 1 | Gland packing leaks | Slurry at the gland, extra gland water used | 3 | 8 | 3 | 72 | 5 × 1 = 5, low |
| 2 | Impeller wears below 400 m³/h | Underflow falls and the thickener backs up | 5 | 6 | 3 | 90 | 4 × 3 = 12, high |
| 3 | Bearing seizes, lubricant contaminated | Pump out for two shifts, shaft damaged | 7 | 3 | 6 | 126 | 3 × 3 = 9, medium |
| 4 | Casing wears through | Slurry released to the bund and the floor | 8 | 3 | 2 | 48 | 3 × 4 = 12, high |
| 5 | Shaft fractures at the sleeve | Sudden stop, impeller and casing damage | 9 | 1 | 8 | 72 | 1 × 4 = 4, low |
The RPN is severity × occurrence × detection. Ranked by RPN the order is the bearing seizure (126), the impeller (90), then the gland leak and the shaft fracture tied at 72, and the casing wear-through last at 48.
That ranking has three faults. The casing wear-through is last, yet it releases slurry to the ground and can be expected to happen within the life of the pump, so the matrix puts it equal first with the impeller. A severity of 8 is cancelled by an occurrence of 3 and a detection of 2. The gland leak and the shaft fracture tie at 72, although one is a housekeeping job and the other is a sudden failure with no warning. And the RPN multiplies three ordinal scores. A step from 4 to 5 on one scale is not the same size as a step from 8 to 9, so a product of the three means little beyond a rough order.
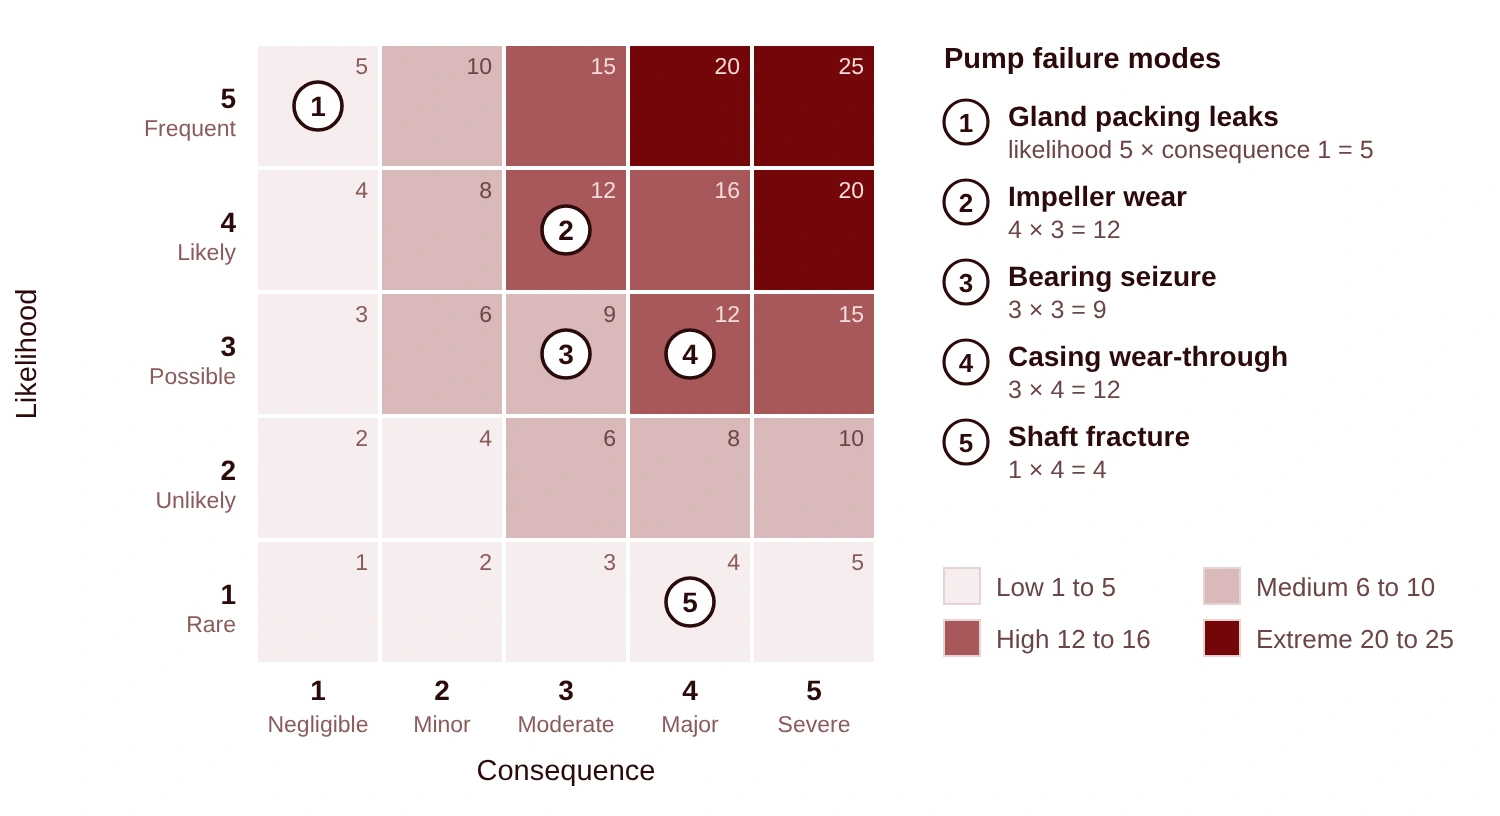
The matrix is easier to defend because its consequence categories can be taken from the site’s own risk standard, so a rating of “high” means the same thing on the FMECA as it does in the risk register. Add one rule on top of it. Any mode with a safety or environmental consequence of 4 or 5 gets a task decision whatever its rating. The shaft fracture rates low because it is rare, and it stays on the list because of its consequence.
Where the plant already ranks its assets by criticality, run the full analysis on the critical assets only. Medium-criticality assets are better served by reviewing the tasks they already have, and low-criticality assets by a standard task set or by running to failure.
Choosing a task for each failure mode
Every mode that is worth managing needs one of four answers, and the order of the questions matters. Ask about a condition-based task first, because it is the one that avoids both the failure and the cost of replacing a part that still has life in it.
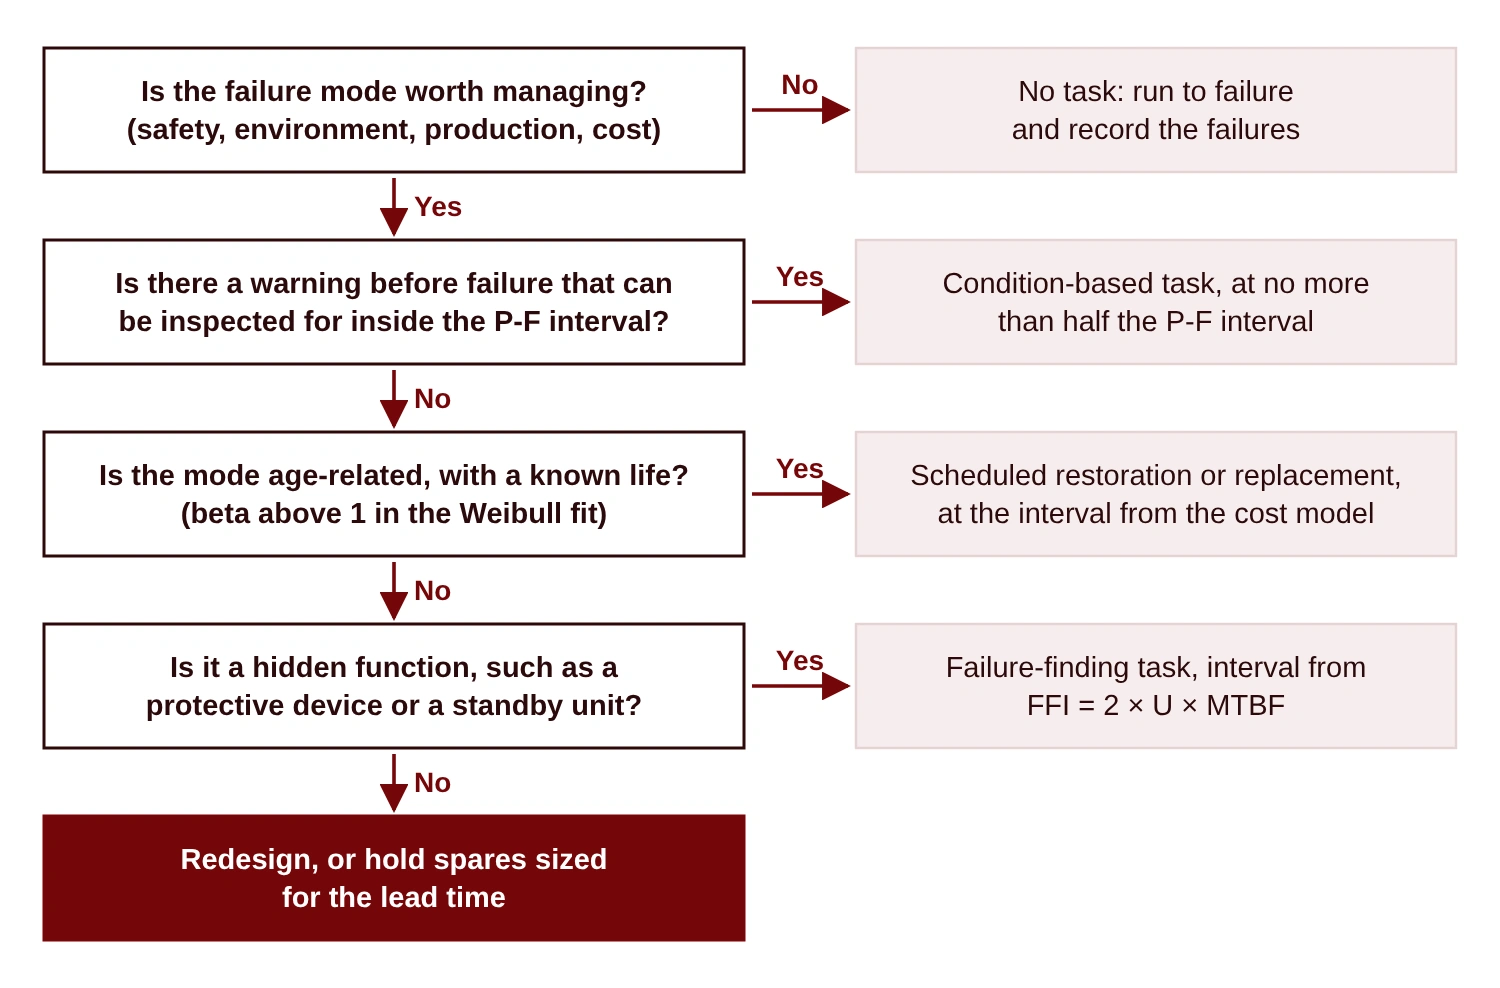
Condition-based tasks. Many modes give a warning. A bearing defect shows in vibration and temperature before the bearing seizes, and a casing loses wall thickness gradually. The time from the first detectable sign (point P) to functional failure (point F) is the P-F interval. An inspection finds the defect only if it is done more often than that interval, and the usual rule is to inspect at no more than half of it, so that a defect is found with at least half the interval left to plan the repair.
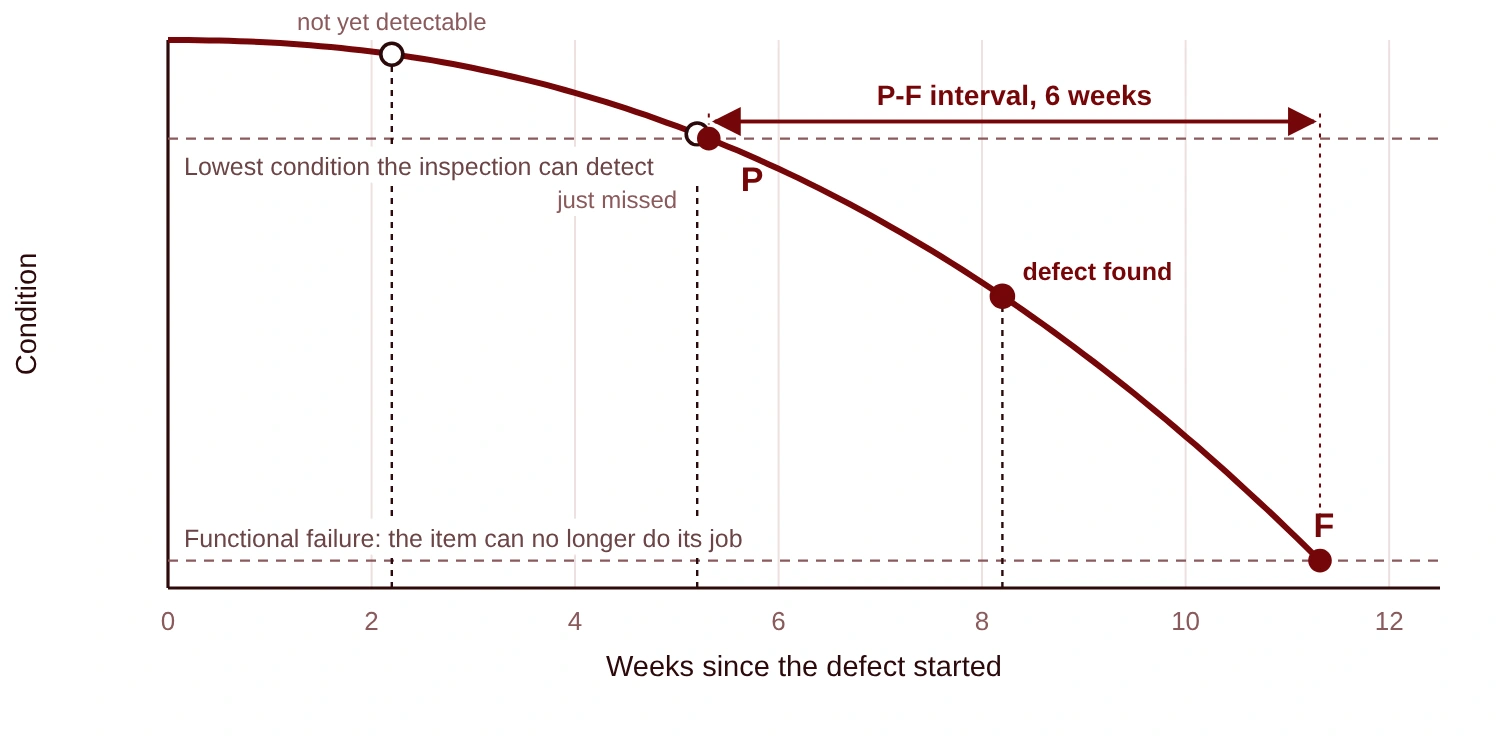
In the plate the P-F interval is 6 weeks, so inspections are every 3 weeks. The week 5.2 inspection falls a few days before the defect becomes detectable and finds nothing. The next one, at week 8.2, finds it with 3.1 weeks left. Two checks decide whether the task is worth having. The time left after detection has to exceed the time to get the parts and a crew, so a 6-week P-F interval is of no use on a component with a 10-week lead time, unless a spare is held. And the P-F interval should come from the failure history, not from a supplier’s brochure.
For the casing in the example, wear is progressive and measurable, so a thickness survey gives the interval directly. With 17 mm of usable wall and wear of 3 mm per 1,000 hours, the casing has about 5,700 hours from new. A survey every 1,500 hours puts three or four readings between new and the limit, enough to draw the wear line and plan the replacement.
Scheduled restoration or replacement. Where a mode is age-related, a fixed-interval task can work. Fit a Weibull distribution to the failure times. A shape parameter (beta) near 1 means the failure rate is constant, so replacing on the calendar removes parts that still work and adds no protection. A beta above 1 means wear-out, and an optimum interval exists when a failure costs more than the planned replacement. The interval comes from the cost model, with the cost of failure and the cost of the task as inputs. The maintenance interval calculator runs that calculation, and the article linked at the end explains how cost, reliability and risk trade off.
Failure-finding tasks. A hidden function is one whose failure nobody sees until the function is needed: a low-flow trip, a relief valve, a standby pump. The task is a test, and the interval comes from the availability the plant requires. FFI = 2 × U × MTBF, where U is the unavailability the plant will accept and MTBF is the mean time between failures of the protective device itself. If a relief valve fails to open once in 10 years and the plant will accept 1% unavailability, the interval is 2 × 0.01 × 10 = 0.2 years, about 10 weeks. A quarterly test would leave the valve unavailable 1.25% of the time.
No task, redesign, or spares. Where the consequence is minor and no task costs less than the failure, run to failure and record each one, so that the decision can be checked against data. Where the consequence is serious and no task reduces it, the answer is a design change, or a spares holding sized for the lead time.
For the five pump modes the answers could be:
| Failure mode | Task | Interval | Trade | Plant state |
|---|---|---|---|---|
| Gland packing leaks | Check gland water flow, adjust the packing | Daily, on the operator’s round | Operator | Running |
| Impeller wears | Trend head and motor current, replace the impeller when head is 10% below the new-pump curve | Monthly | Reliability technician | Running |
| Bearing seizes | Vibration, temperature and oil sample | Fortnightly | Condition monitoring technician | Running |
| Casing wears through | Ultrasonic thickness survey at marked points | 1,500 hours | Inspector | Running, with access |
| Shaft fractures | Magnetic particle test of the shaft at each rebuild, and a review of the sleeve and key design | Each overhaul | Fitter and inspector | Stopped |
Running the workshop
A workable group is a reliability engineer who facilitates, a maintainer who has repaired the item, an operator who runs it, and a planner. Add a condition monitoring technician where a monitoring task is likely.
Prepare first. Bring the asset hierarchy and the criticality ranking, two to five years of work orders with failure codes, the supplier manual, the P&IDs, and a description of the duty: the slurry density and abrasiveness, the running hours, the redundancy. A Weibull fit of the failure times from the work orders shows which modes are age-related before the workshop starts. A draft built from a library for the asset type saves time, but check it against the duty. Clean water and abrasive slurry give the same pump different failure modes at different rates.
Work down the rows. Take one item at a time. Start with the function and its performance standard, then the functional failures, then the modes. Do not leave a row until the cause is specific enough to aim a task at.
Agree the scales before scoring. Use the site’s risk matrix. Write down what each consequence level means in money, injury and environmental terms, and what each likelihood level means in years, so that two people scoring the same mode reach the same number.
Do the analysis once for each type of asset. Six identical pumps in the same duty need one analysis, with the differences noted. Repeating it for every tag wastes the group’s time.
Check the result. About 90 days after the strategy goes live, compare the failures and the task findings with what the analysis predicted. Modes that were missed go back into the analysis.
Mistakes that make the result unusable
- Symptoms written as failure modes. “Pump vibrates” is a symptom. The mode is the bearing defect, the unbalance or the cavitation behind it, and each has its own task.
- Detection scored on the wrong thing. A condition monitoring task counts as a detection control only if the equipment is on the route and the alarm limit is set. Scoring detection low because a sensor exists, when nobody reads it, understates the risk.
- Analysing everything. Running the full analysis on low-criticality assets uses the group’s time on work that will not change a decision.
- Stopping at the ranking. The output is a set of tasks with intervals. A ranked list of failure modes with no tasks has not changed the maintenance programme.
- Tasks that stay in the report. A task that is not in the CMMS as a task list, with its frequency, trade, duration and plant state, will not be planned, scheduled or counted.
FMEA or FMECA
| FMEA | FMECA | |
|---|---|---|
| Output | Failure modes, causes and effects | The same, ranked by criticality |
| Suited to | A single design, a small system, a commissioning review | A plant with many assets and a limited maintenance budget |
| Ranking | None, or judgement | Risk matrix, RPN or criticality number |
| Typical use | Design review | Maintenance strategy development, RCM |
For an operating plant, use an FMECA scored on the site’s own risk matrix, and add the consequence assessment and task selection from RCM. Then load the tasks to the CMMS, with the parts for each task linked through the bill of materials, so that the strategy is carried out as planned and scheduled work.
Miguel Pengel, RPEQ (Mechanical) 28380, is the principal engineer at Pardus Consulting and the author of Reliability Engineering for Heavy Industry. About Pardus.